
The5ers has opened up its trader data to the public. Its new leaderboards rank traders on three boards: P&L, Payouts and Quality Score.
We went through the top 20. These are the 20 traders who have been paid the most at The5ers, between $86,000 and $129,000 each.
A clear picture comes out of it. Almost all of them trade gold. About half of them lose more trades than they win. They keep their trades short. And The5ers' own skill scores rate most of them as average.
Gold is the dominant market
If there's one market the top earners have in common, it's gold.
For 17 of the top 20 payout earners, gold is the market they trade most. Only three break the pattern: one trades mostly the NAS100, one spreads across dozens of forex pairs and indices, and one splits almost evenly between Bitcoin and gold.
For many of them, gold isn't just their main market. It's close to their only one. Seven of the top 20 put more than 90% of their trades into gold, and three of those are above 99%. They aren't hopping between pairs. They trade the same market over and over.
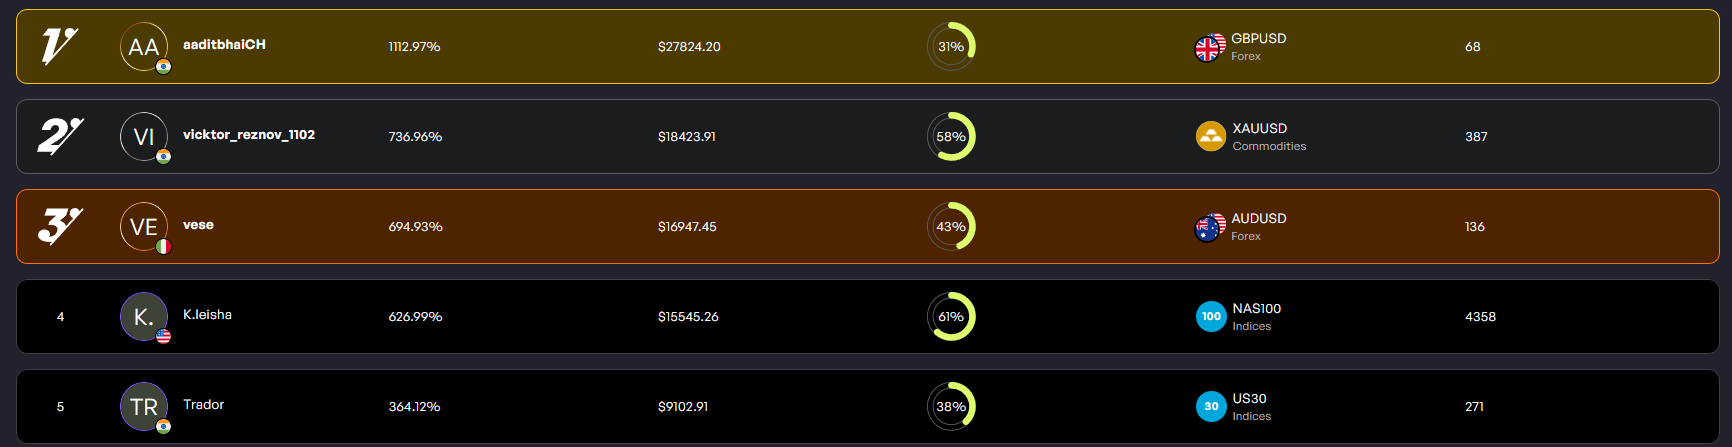
The yearly P&L board is more mixed, with GBP/USD, AUD/USD, NAS100 and US30 near the top. Even there, gold is the best asset for 6 of the top 20.
It makes sense. Gold has moved a lot over the past two years, and a market that moves that much during the day gives a short-term trader plenty to work with.
Top earners often lose more than half their trades
On the all-time Payouts board, the top 20 have an average win rate of 48%, and exactly half of them win less than half of their trades. The trader in second place has collected more than $125,000 in payouts with a 29% win rate. Seventh place sits at over $114,000 while winning just 27% of the time.
The yearly P&L board tells the same story. The top 20 there also average 48%, and the trader in first place is up more than 1,100% on the year with a 31% win rate. Several others in the top 15 win between 18% and 38% of their trades.
For a trader who wins less than half the time to stay profitable, their winners have to be bigger than their losers. That's just the math, and it shows how little win rate on its own tells you. It's all about the risk-to-reward.
Short holds, not swing trades
None of the top 20 are swing traders. Their average hold time ranges from about an hour and a half to 11 hours, and half of them hold for less than three and a half hours. Trades held for days make up 12% of any one trader's activity at most, and for most of them it's close to zero.
The split between scalping and day trading is almost exactly even. Going by The5ers' own breakdown, about 10 of them mostly day trade and about 10 mostly scalp.
There's no single strategy that is the best
The leaderboards also show that very different styles end up in the same place.
Among the top 20 payout earners, the number of trades ranges from under 700 to more than 14,600. One of them passed $100,000 with just 8 payouts, while others took 36.
The same goes for how many assets they trade. Six of the top 20 actively trade five assets or fewer. At the other end, two of them trade around 40 different instruments each.
The yearly P&L board is even more extreme. The trader in first place got there with only 68 trades all year. Just a few places below, another trader is in the top five with more than 4,300.
The skill scores tell a different story
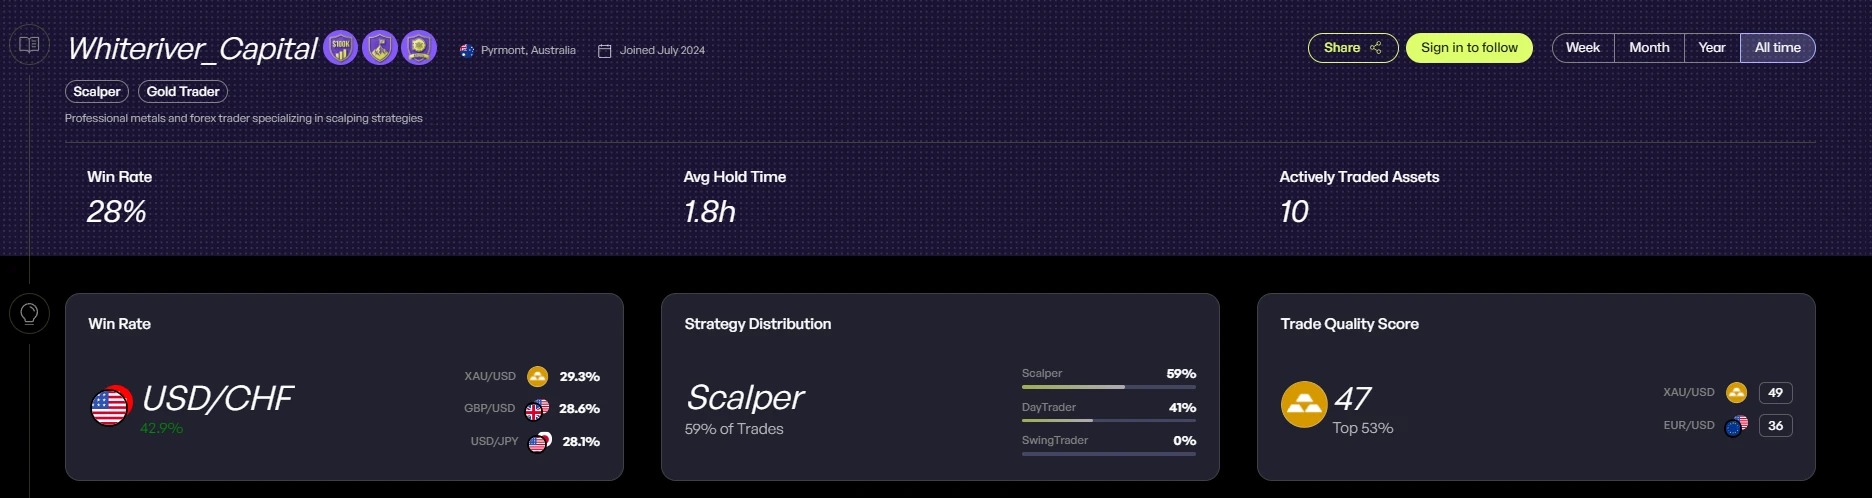
Every profile also shows a Trade Quality Score and an overall skill score, which The5ers builds from things like consistency, discipline and risk management.
By those measures, most of the top earners look fairly ordinary. Only five of the top 20 rank in the top 20% of traders on Trade Quality Score. For the 19 who have a full skill score, it sits between 40 and 53 out of 100.
The Quality Score leaderboard is a different group of people altogether. None of the top 20 payout earners appear in its top 20. That board is led by traders with very high win rates, up to 94%, but most of them have only 25 to 50 trades this year.
They measure how clean the trading looks, not how much it has earned. But it's a good reminder that the traders who get paid the most aren't always the ones with the best looking stats.
How to read these numbers
A few things are worth keeping in mind before comparing yourself to the board.
P&L % depends on account size. The trader in first place on the P&L board is up over 1,100%, which works out to about $27,800. The trader in 20th place is up "only" 196%, but that's more than $55,000.
The numbers don't always line up. Some traders' payout totals on the board are lower than the totals on their own profile badges, and the trade counts on profiles are sometimes lower than on the leaderboard. The two likely count different programs or periods, so treat the figures as close, not exact. We reached out to The5ers, but haven't received a response yet.
The boards change constantly. Rankings update every few hours.
What it means for traders
If you're trying to get funded and paid, these profiles are a useful reality check. You don't need to win most of your trades. You don't need to trade a dozen markets or hold positions for days. And you don't need a perfect skill score.
Most of the top earners lean hard on one asset, and keep their trades short. Beyond that, what they share is time. None of them got there in one big month. They took between 8 and 36 payouts each and kept trading long enough for those payouts to add up.
It's also a good move by The5ers. Very few prop firms show this much about what their traders actually do, and that kind of transparency is still rare in this industry.
You can browse the full leaderboards on The5ers' hub.
Source: The5ers public leaderboards.